 |
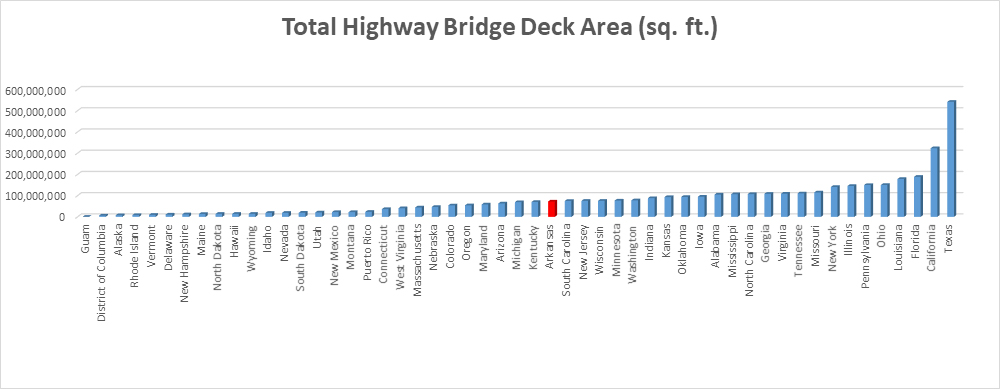
Figure 1. Arkansas Total Bridge Deck Area in comparison to the other States. |
| Figure 1 shows a graphical representation of the amount of bridge deck area associated with each of the 50 states as well as Guam, District of Columbia, and Puerto Rico. Arkansas is shown in red with 72,211,254 square feet of total bridge deck area for Arkansas Bridges. This equates to Arkansas being ranked 29rd out of the 53 governmental entities in this group for most deck area. |
| |
| |
 |
Figure 2. Quantities of Conditions for all Arkansas State Owned Bridges |
| Figure 2 shows percentages by bridge count and by bridge deck area for conditions of Good, Fair, and Poor. Bridges are evaluated based on NBI standards and reported yearly. The values shown in figure 2 represent the latest values (2018) reported to the U.S. Department of Transportation from the State of Arkansas. |
| |
| |
 |
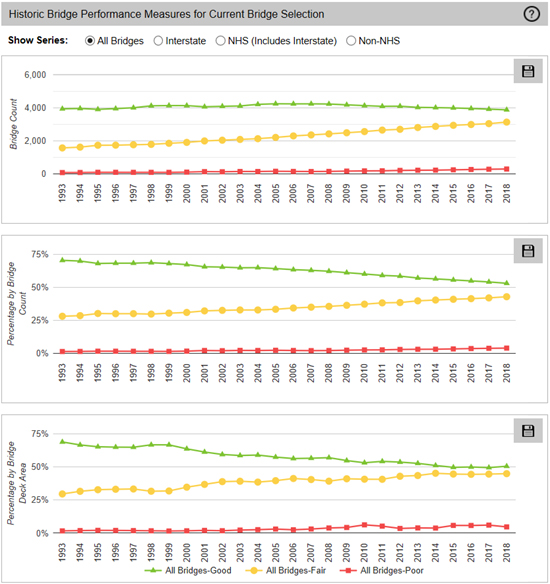
Figure 3. Historical representation of Arkansas’s State Owned Bridge Conditions (Good, Fair, Poor) |
| The data shown in Figure 3 spans from 1993 to 2018 (Current). The first set of data shows the Bridge Count, or number of bridges each year rated as Good, Fair, or Poor. The second set of data shows the same data in the form of Percentages by Bridge Count. The third set of data shows the Percentage by Bridge Deck Area. All three ways of analyzing the data show the same general trends. |
| |